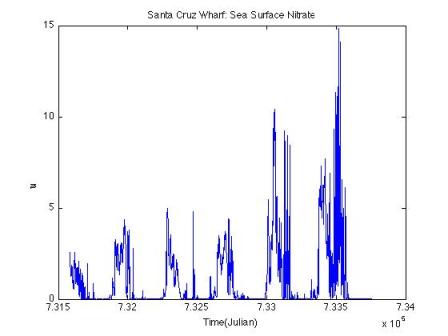
A wide array of data can be produced using a ROMS model. Below are several plots generated with ROMS data output from the pixel closest to the Santa Cruz Wharf. All data shown is from January 1, 2003 through December 12, 2008. This plot shows
sea surface nitrate. Y-axis units are umol N/L.
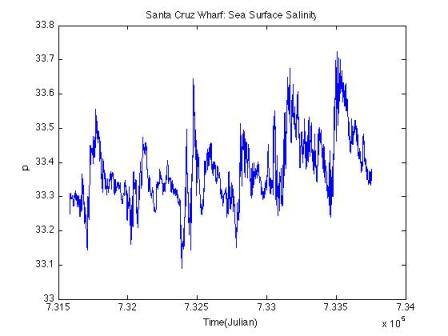
Sea surface salinity. Y-axis units are psu.